Skip to content

Monitor Visualization

Monitors are information available on a device, such as CPU, memory, disk, etc. Each device provides exclusive resources that can be monitored. Monitor colors vary according to their state.
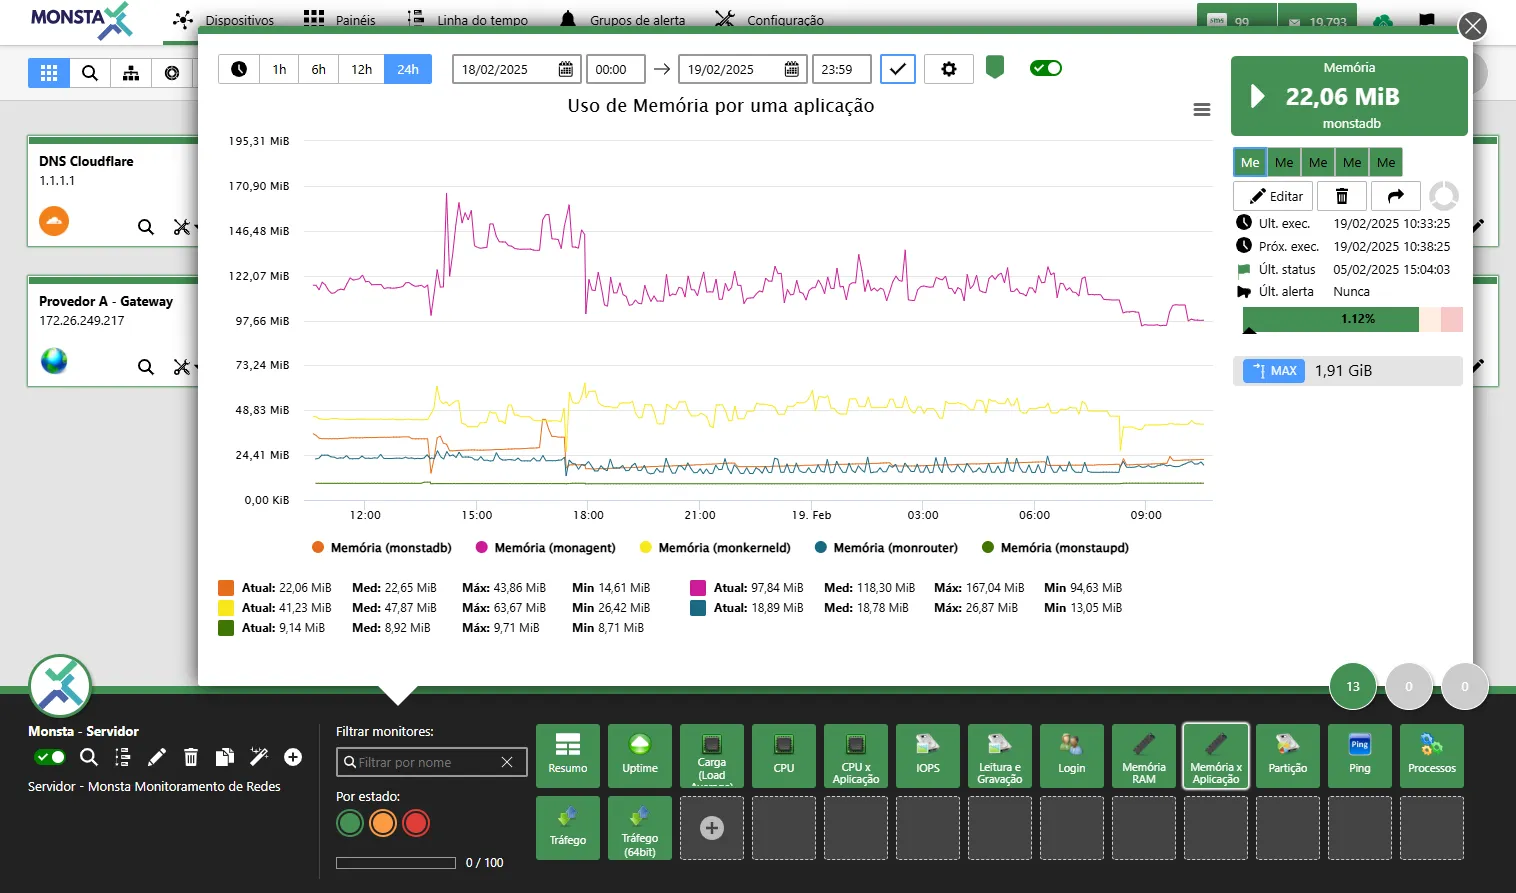
image-1739972140083.png


image-1646943045253.png Real-time Chart: Displays the chart updating its data at the selected time interval.


image-1732626960803.png Sampling Period: Customizes the period of the chart to be generated.


image-1646943186232.png Chart Properties: Opens the screen with the properties of the displayed chart.

ÍconeDescrição
image-1732627382742.pngTitle: Name that will appear at the top of the chart.
image-1646943518875.pngLimits per reading: When enabled, fills the entire chart according to the period status during the readings.
image-1646943561235.pngShow Status Markers: When there is a status change in the presented time period, Monsta adds a marker to visualize when and to which state the change occurred.
image-1732627513437.pngHide values: Removes the reported values from the bottom of the chart presentation.
image-1732627598700.pngHide legend: Removes the legend from the chart presentation.
image-1732627665080.pngShow variation only: Renders the chart only with its variations for a better view of changes.
image-1732627792522.pngLegend color: Customizes the text color of the legends at the bottom of the chart.
image-1732627851295.pngBackground color: Customizes the chart background color.
image-1732627906990.pngLegend font size: Customizes the legend size at the bottom of the chart.
image-1732627963075.pngLine width: Customizes the width of the line rendered on the chart.
image-1646943757386.pngShow Percentile Indicator: Adds the selected percentile to the chart.
Group Data by TimeGroup the data by time: When there is a time period greater than two days, Monsta groups data and automatically generates an average of the information to be presented on the chart. In this property you can choose the time that this grouping will use or simply disable this property.

image.png

Enable Monitoring: This button allows enabling or pausing data collection and chart display for the selected asset. When the monitor is disabled, collection is stopped immediately, ceasing metric processing and the sending of associated alerts, without removing the history of data already stored.


image.png

Clone Monitor: Use this functionality to replicate the monitor. By triggering this button, you will open a list to select the destination device, inheriting all metrics, alert thresholds and verification parameters configured.
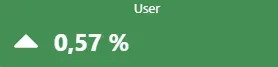

image.png

Metric Value: Shows the metric name, the current reading value and whether the result is higher, lower or equal to the previous reading.
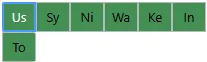

image-1732628094300.png Metrics: Displays information about each individually monitored resource.


image-1647016828331.png Edit: Changes the properties of the selected monitor.


image-1647016882068.png Delete: Deletes the selected monitor.


image-1647016926788.png Publish: Creates a link to publish the chart without the need for authentication. For more information, see Publish a Monitor


image-1647017067003.png Number of Attempts: Indicates the number of monitor attempts before leaving the normal state.


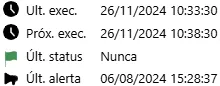
image-1732628125264.png Monitor Information: Displays the date of the last check, the date of the next check, the last status change and the date of the last alert sent.


image-1732628187732.png Percentage: Displays the percentage of the resource used by the selected metric when a maximum value is provided.


image-1756124792478.png Export / Calculate Area: The information collection chart offers three main options for interacting with the viewed data:

  • Export as Image: In the top right corner of the chart, click the “Download” or “Export” icon to save the chart as an image file. This allows you to use the image in reports, presentations or easily share it.
  • Export Data: You can export the raw data in spreadsheet formats for later analysis. Available formats are CSV and XLS.
  • Consumption Report: For a more in-depth analysis, you can calculate the area under the chart curve. This function is ideal for obtaining accumulated or total values over the selected period. Click the “Consumption Report” option and the result will be displayed in a text box, ready to be copied or used in your calculations.

Publishing a monitor allows the user to create a link for internet access without the need for a username and password.
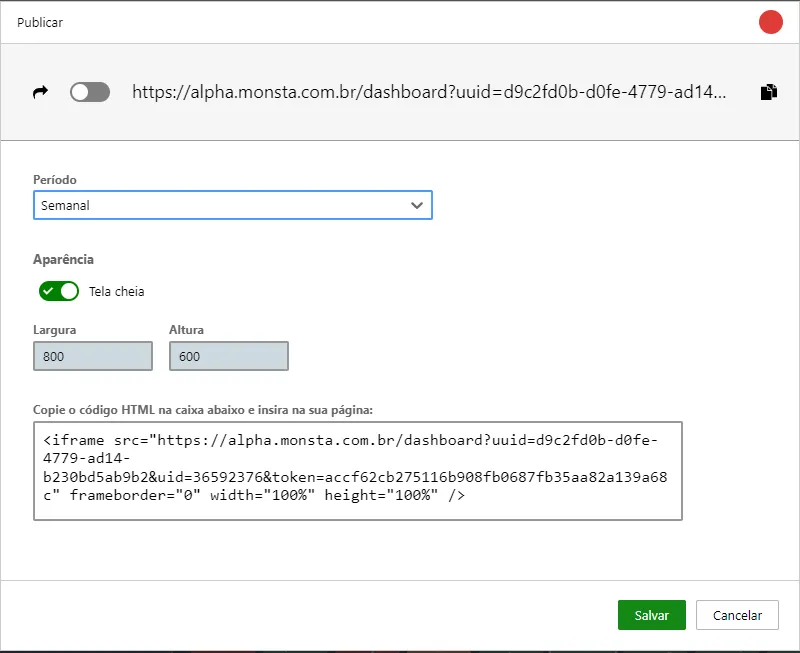
image-1647023048029.png

  • Publish: Enables creating the link for the selected monitor.
  • Period: Allows choosing the publish duration of the chart. For security, periods longer than one month are not allowed.
  • Fullscreen: When enabled, uses the entire screen to display the chart.
  • Width and Height: Sets the chart dimensions in pixels.
  • HTML Code: This code is generated by Monsta for the selected monitor and can be used to publish the chart on a third-party dashboard.

Editing a monitor allows customizing important information about its behavior, such as collection frequency, alert thresholds and its script for how to fetch information.
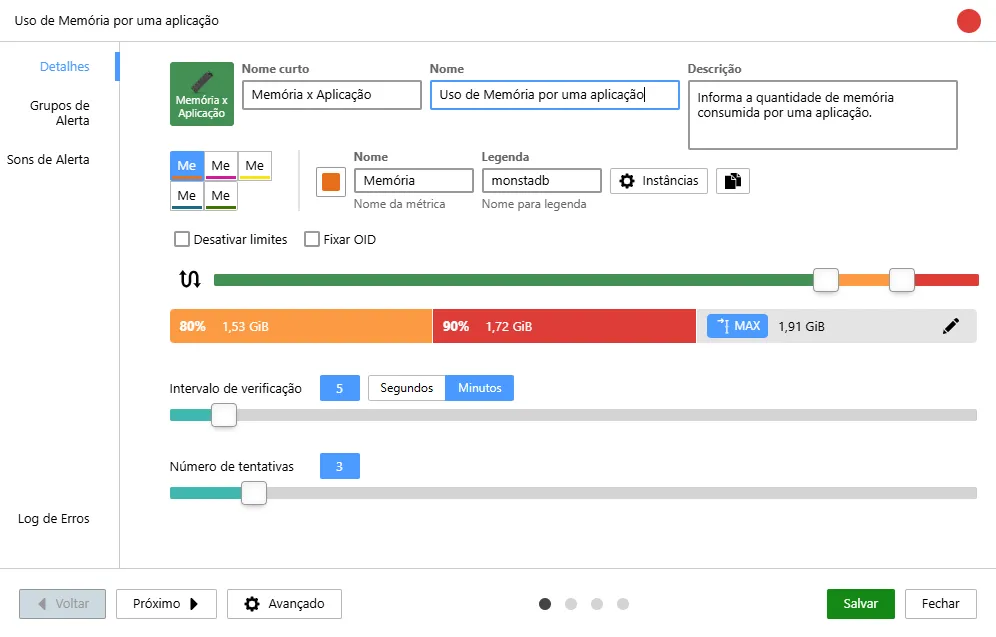
image-1739972270800.png

image-1739972288968.png Icon: Allows selecting the icon that will be displayed on the screen.


image-1739972320658.png Short name: This is the text that will appear on the monitor icon.


image-1739972336891.png Name: This is the text that will be shown at the top of the monitor chart.


image-1739972366625.png Metrics: These are the resources whose data will be collected for the chart.


image-1732629430867.png Color: Selects the color that will be rendered by the metric on the chart.


image-1732629288328.png Metric name: This is the name that will be shown in the legend of the current reading indicator.


image-1739972396801.png Legend: This is the name that will be shown in the chart legend and in the current value indicator for the selected metric.


image-1732629728817.png Instances: Allows changing the current instance of the metric.


image-1647108824415.png Clone: Allows adding a new metric to the same monitor.


image-1732629952003.png Disable Limits: When checked, disables sending alerts for the monitor being edited. The selected metric will always be considered in a normal state.


image-1732630014138.png Fix OID: When unchecked, Monsta will verify if the name of the monitored instance remains at the same OID and in case of change, the new position will be located automatically. When this option is checked, Monsta will collect data always from the same OID, regardless of the instance name.


image-1647109347088.png Threshold Inversion: This option allows you to change the alert logic of a monitor. Use this feature for metrics where a low value indicates a problem (e.g., the speed of a network interface should not drop below a certain level) or where you need to monitor specific ranges of values.


image-1647109503541.png image-1647109809636.png Alert Percentage: Allows selecting at which values the metric will enter an alert state. When a maximum value is defined, alert configuration will be in percentage; otherwise, limits are provided textually.


image-1647110437143.png Check Interval: Allows selecting the frequency at which the monitor will run.


image-1647110506456.png Number of Attempts: Allows selecting how many times the monitor should be checked before leaving its normal state. When a monitor returns to normal before reaching this limit, this counter is reset.


image-1732630557678.png Notify alert group: When enabled, sends alerts to the selected groups; otherwise, Monsta will not send alerts even when the monitor changes status.


image-1732630665348.png Inherited from device: These are the alert groups defined in the device edit. Once inherited, they cannot be removed from the monitor, only disabled.


image-1732630758350.png Add Alert Group: Adds groups that will receive alerts when the monitor changes state. For more information see Alerts.


image-1647111288941.png Remove Alert Group: Removes the selected alert group.


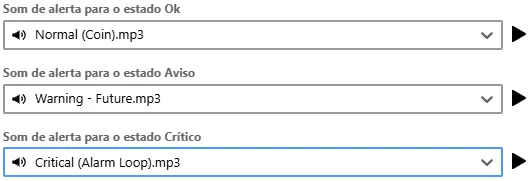
image-1732630990555.png Allows adding custom alert sounds for each monitor status.


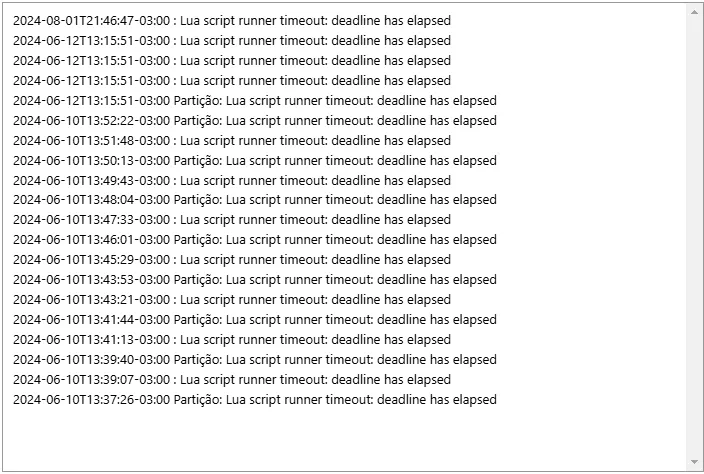
image-1732631123766.png Shows the latest failures that occurred during monitor collection. This log is useful to know the reason why a collection is not being successfully performed.

image-1647113062837.png

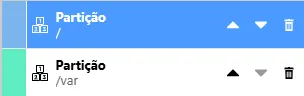
image-1732638791772.png Metrics: Allows changing the metric display order, removing it or editing it. For more information on how to edit a metric see Metrics.


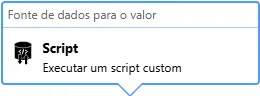
image-1732638931351.png Data source for the value: It is the method that Monsta will use to collect information for this metric. For more information, see Metrics.


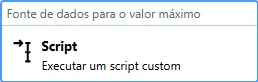
image-1732639055201.png Data source for the maximum value: Used when the monitor has a maximum limit value. For more information, see Metrics.


In this tab the parameters used by the selected monitor and their respective values are provided.